2018 - Caterina
Caterina, named after my niece, was a project to collect data about events related to cryptocurrencies and their price fluctuation. Then maybe I could find some reproducible patterns to reliably predict it and short or long it. I wanted to identify a function such that
F(cryptocurrency, event category) => (price variation around the event, confidence)
For example, F(ETH, community event) => (+10%, 90%).
Beside getting rich, this project combined three goals:
- Identify patterns in the crypto market dynamics.
- Applying the Reactive Architecture principles in a new project.
- Practicing development and maintenance of a relatively simple data pipeline.
I wrote a lot about this project, the full writeup is accessible here. I also toured with a talk about this project, called ‘Tame Crypto Events With Streaming’, recording here.
As a brief recap, I didn’t get any richer 😅
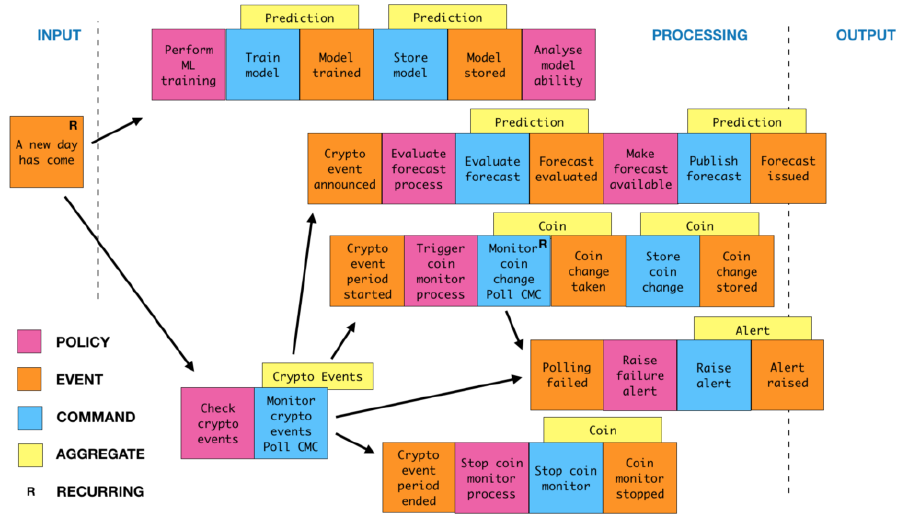
I enjoyed very much doing things the right way, starting with proper modeling of the problem space using Event Storming:
Next,
- model the flow to DDD objects and bounded contexts
- implement the model in Scala, Akka and Akka Streams
- put everything in containers and run it on Google Cloud’s Kubernetes.
The logical steps from bounded contexts to streaming are shown in this image, and a little code is below:
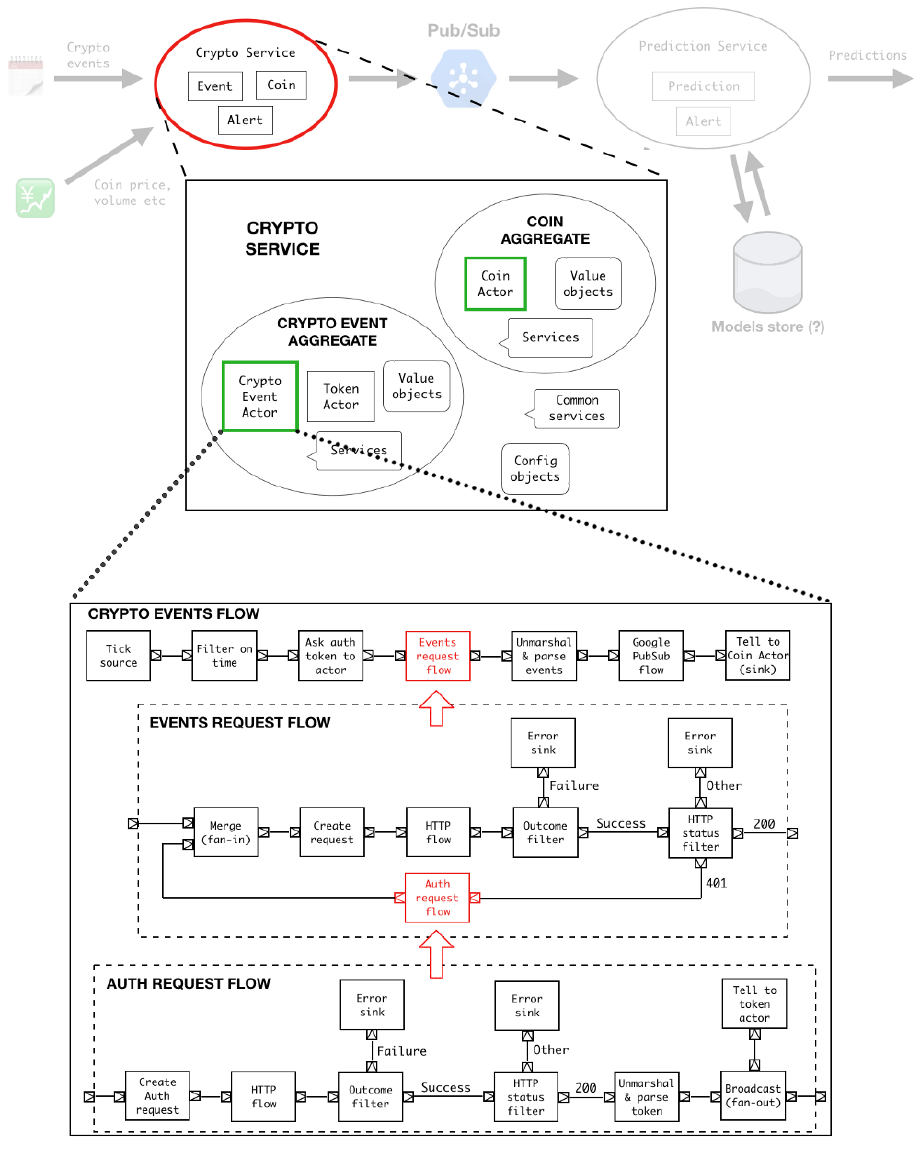
The top stream (the one just below the ‘CRYPTO EVENTS FLOW’ in the image above) looked like this:
Source
// emits a GiveToken object once a day
.tick(0.seconds, 1.day, GiveToken)
// asks the Token Actor the auth token, is received as a string
.mapAsync(1)(msg => (tokenActor ? msg) (3.seconds).mapTo[String])
// passes it to the event request flow, implmented separately
.via(eventRequestFlow)
// unmarshal the results and maps it to my internal CoinEvent object
.map(eventListUnmarshaller)
.map(_.flatMap(EventAPI.toCoinEvents))
// publishes the result on Google Pub/Sub, implemented separately with Alpakka
.via(eventPubSubFlow)
// forwards the event list to the Coin Actor
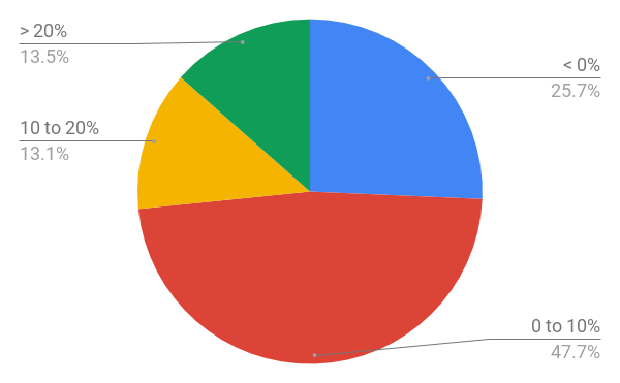
.runForeach(ev => coinActor ! ev)After a few months of data collection, it was time to perform some data analysis; you can read the outcome of it here, with lots of colored graphs.
For instance, a promising first observation that the mean price of a coin in the two days after the event went up in almost all cases:
One issue is the extreme volatility of cryptocurrencies. For example here is the price fluctuation of ETH around an ETH conference in November 2018:
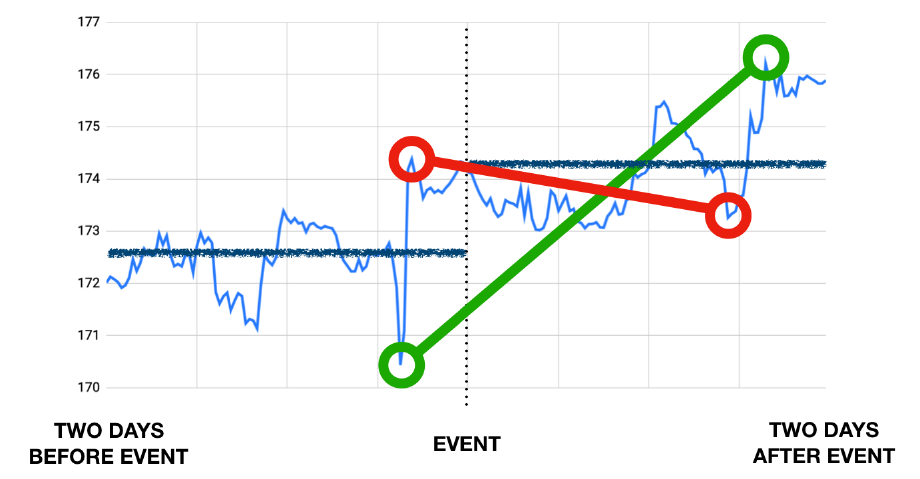
Ideally, you want to buy and sell as per the green line, and avoid the red operation. If you are curious, read more of my conclusions!
All in all, this project was a super learning experience, touching a data project from A to Z and gave me a chance to speak at lots of different conferences.
